
By: Tatwadhika Siddhartha, Climate Strategy Project Lead – Bestari Sustainability
“If we really wanted to count every emission, we could put a sensor on every chimney, vehicle, and rice paddy. But how many millions of sensors would that take. And more importantly, who would pay for them?”
That question gets to the heart of an issue we rarely talk about, while businesses and governments alike are rushing to decarbonize, but the foundation of climate action, which is our ability to measure emission, is far from perfect. Yet, this imperfect foundation is what shapes carbon taxes, net-zero targets, ESG disclosures, and climate claims on everything from food labels to investment portfolios.
Across the globe, companies are being asked to “know their numbers”. How much do you emit? How much will you cut? How quickly can you do it? But the problem is that not all emissions are equally visible, equally measurable, or equally accounted for.
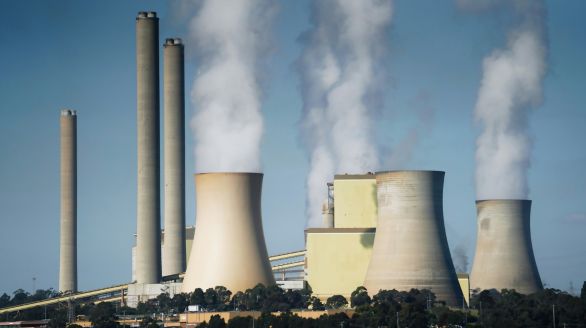
Some emissions are relatively easy to calculate. For example, if a manufacturing plant burns diesel, it can estimate emissions using fuel purchase records and standard emission factors. These are known as Scope 1 emissions, or known as direct emissions from sources a company owns or controls.
Others are trickier. For example, Scope 2. The emission itself comes from purchased electricity, which means it depends on where your energy comes from, while the carbon footprint of a kilowatt-hour can vary dramatically. Let us take an example of Indonesia’s grid, they heavily reliant on coal in certain regions, meaning electricity use there is more carbon-intensive than in places with a greener mix
Afterward, there is Scope 3, or known as the elephant in the emissions room. It also includes everything upstream and downstream, starting with the emissions that come from the material making you buy, transporting them, using your products, and even dealing with them after disposal. For most companies, Scope 3 accounts for over 70% of their total footprint, and yet, it is often the least measured.
No one is expecting perfection because emission inventories are estimates; built from a mix of real measurements, activity data (like fuel use or kilometers travelled), and standardized emission factors. Hold up, even the best estimates face big challenges.
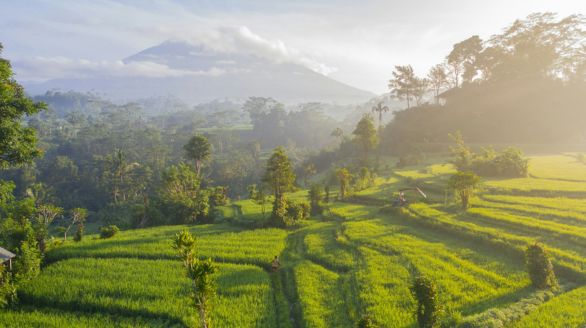
However, some of the country’s biggest emissions do not come from smokestacks or traffic, yet it comes from peatland fires and land-use change fires. In 2015, during the wildfire season, daily emission from peat and forest fires exceeded the daily emission of the entire United States. It is not an easy thing to track, because they happen across remote areas, fluctuate with weather, and are only partially visible through satellites. When it has to be measured, the data is backward-looking, therefore by the time we quantify the damage, the carbon is already in the atmosphere.
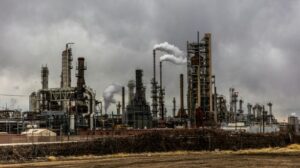
Similarly, small-scale industries and informal sectors contribute unaccounted emissions like brick kilns, food processors, backup diesel generators, which rarely make it into national inventories. These operations are hard to monitor, scattered across the country, and often unregistered, while in aggregate, they contribute a significant share of real emissions.
Even in formal sectors, data gaps are still a real challenge. For example, supply chain emissions, most companies end up using broad averages instead of real data, while it makes sense, yet not every company has the power or tools to track emissions in real time from every supplier, transporter, or customer. But this also means that the final number in an emissions report often carries more uncertainty than it seems on paper.
Indonesia and many developing countries are facing greater challenges in counting the emission. Starting with underfunded government reporting systems, limited MRV (Monitoring, Reporting, and Verification) infrastructure, and many outdated emission factors. For example, coal, mining, and agriculture are the sectors that underreporting became the norm, it is simply because site-specific data is missing.
The result is a paradox; we are building sophisticated climate strategies on top of data systems that are still catching up.
So, What is the Point of Counting?
You might be tempted to ask; if the numbers are not exact, why bother counting at all?
The answer lies in direction, not perfection.
Emission inventories are not designed to be accurate down to the last decimal point. Because the real purpose is to disclose where your emissions come from, in which it can unlock the biggest opportunities for reduction effort, and how your footprint changes over time; in other words it does not need to be exact, but it needs to be useful.
Let us think like driving a car without a speedometer or fuel gauge. Although if those instruments are not perfectly calibrated, they still help you avoid running out of gas or getting a ticket. This is how carbon accounting works, it gives you a dashboard to manage risks, spot inefficiencies, and plan ahead. It is just as important as keeping the business going, because it signals investors and regulators that you understand the impact, while also building awareness inside your company that emissions are not only a planetary concern, but they are a business issue too.
Why Businesses Cannot Wait
More than ever, companies are expected to take climate seriously; not just in words, but in numbers.
On the other hand, the governments are responding to the demand. Indonesia is currently preparing to implement a carbon tax and has already piloted an emissions trading system (ETS) for the power sector. In the foreseeable future, more sectors, starting from cement, fertilizer, pulp and paper, are planned to be included. When the time comes, companies then will need reliable emissions data to participate, comply, and avoid financial penalties.
Global buyers are also tightening the screws. For example, The European Union’s Carbon Border Adjustment Mechanism (CBAM) will impose a carbon price on imported goods like steel, aluminum, and fertilizers; unless exporters can prove their emissions are low or well-managed. If companies cannot provide a clear, defensible carbon data risk, then they will lose access to key markets.
Then there is the ESG push. Investors and financial regulators are increasingly demanding standardized sustainability disclosures. In Indonesia, OJK’s POJK 51 requires sustainability reporting. Globally, the ISSB standards (IFRS S1 and S2) will soon become mandatory in many jurisdictions. These frameworks ask companies to disclose climate risks and GHG emissions, including Scope 3.
None of this is hypothetical since the regulatory environment is changing now. The companies that are starting to count today are the ones that will remain competitive tomorrow.
So Where Should You Begin?
The good news is: you do not need to boil the ocean. Most companies can begin by:
- Measuring their Scope 1 and 2 emissions using energy and fuel data they already have.
- Estimating key categories of Scope 3 emissions using available supply chain data and industry benchmarks.
- Identifying emissions “hotspots” where improvements would make the biggest difference, it could be energy efficiency, supplier engagement, or logistics optimization.
- Building an internal system (even simple excel-based ones) to track progress year over year.
From there, you can refine. Bring in automation, upgrade to more detailed lifecycle models, collect better supplier data and use digital MRV tools. But the journey always begins with the first footprint.
Although your first inventory is rough, it still creates a baseline. From the baseline, then you can set a target, following that, eventually you can build a roadmap. This is not about perfection, but momentum.
Technology Helps but Leadership Matters More
We now have more tools than ever, starting from satellites that can spot methane leaks from orbit, AI systems that can scan emissions reports for anomalies, IoT devices that can monitor energy use in real time, and even a blockchain is being tested to create tamper-proof emissions records.
But technology only works when paired with intent. Someone has to ask the questions, allocate the budget, make the calls. In other words: data does not lead, yet leaders do.
Companies that act early on carbon measurement are not just future-proofing. They are signaling credibility, building trust with customers, suppliers, and regulators, as well as getting ahead in a world that’s moving, fast, toward transparency and accountability.
From Mirage to Action: Why Start Now
It is not a problem if we cannot count every last molecule of CO2. What matters is acting responsibly with the best information we have, and continuously improving from there.
Every meaningful transition starts with one step: choosing to act rather than to wait. Because progress is rarely perfect, but always possible.
In the end, the biggest emissions we miss are not the ones we fail to count, but the ones we fail to cut.
References
CarbonNeutral. (2024). Scope 1, 2, and 3 emissions explained. Retrieved July 31, 2025, from https://www.carbonneutral.com/news/scope-1-2-3-emissions-explained
Copernicus Atmospheric Chemistry and Physics. (2019). New estimate of particulate emissions from Indonesian peat fires in September–October 2015. Atmospheric Chemistry and Physics, 19(17), 11105–11126. https://acp.copernicus.org/articles/19/11105/2019/
GHG Protocol. (n.d.). FAQ: What are Scope 1, Scope 2 and Scope 3 emissions? World Resources Institute & World Business Council for Sustainable Development. Retrieved July 31, 2025, from https://ghgprotocol.org/sites/default/files/2022-12/FAQ.pdf
Indonesia Ministry of Finance (Kementerian Keuangan). (n.d.). Indonesia berkomitmen pada penurunan emisi. Retrieved July 31, 2025, from https://www.kemenkeu.go.id/en/informasi-publik/publikasi/berita-utama/Indonesia-Berkomitmen-Penurunan-Emisi
Mongabay. (2015, October 16). Carbon emissions from Indonesia’s peat fires exceed emissions from entire U.S. economy. Mongabay Environmental News. https://news.mongabay.com/2015/10/carbon-emissions-from-indonesias-peat-fires-exceed-emissions-from-entire-u-s-economy/
Nature. (2015). Peat fires: Emissions likely to worsen. Nature, 527, 305. https://doi.org/10.1038/527305a
NO-BURN. (2025). Ramping up ambition on waste methane and just transition in Indonesia: Recommendations for Indonesia’s second NDC. Global Alliance for Incinerator Alternatives. https://www.no-burn.org/wp-content/uploads/2025/05/Second-NDC-Indonesia-1.pdf
Reccessary. (2025, March 18). Indonesia unveils plan for cap-and-trade carbon market targeting industrial sectors. Carbon Management News. https://www.reccessary.com/en/news/indonesia-plans-cap-and-trade-carbon-market-industrial-sectors
World Resources Institute (WRI). (2015, October 14). Indonesia’s fire outbreaks producing more daily emissions than entire US economy. WRI Insights.
Climate Strategy Project Lead


 Akil has over 3 years of combined experience across IT consulting, impact investing, and sustainability consulting. He mainly works to identify key business challenges and develop strategic solutions that create commercial value and positive impact. His experience spans business strategy, project development, and cross-sector collaboration, particularly in technology and sustainability initiatives. Akil earned a Business degree from the Bandung Institute of Technology.
 Herlin works as policy research analyst assisting the Sustainable Packaging study and piloting program. She has been studying the plastic pollution issue for more than a year as part of Indonesia NPAP/WRI Indonesia and Bestari. Herlin’s interest is on public policy, environment, and human rights. She holds a degree in Law.
 Widya has over 6 years of experience in financial administration. She has strong expertise in financial reporting, budgeting, and administrative processes. She ensures smooth operational and financial workflows, contributing to effective and accountable project implementation.
 Daffa focuses on climate strategy communications and corporate sustainability engagement for over 1 year, helping companies translate climate ambition into measurable action. He crafts compelling narratives and simplifies complex climate concepts into clear, actionable strategies to ensure effective implementation and tracking. Daffa holds a Bachelor’s degree in English Literature from BSI University.
 Rahma has practical experience across multiple industries, focusing on GHG inventories (ISO 14064 Verification Validation), and the implementation of various ISO standards. She has supported companies in improving environmental performance and aligning with sustainability goals. She holds a Bachelor’s degree in Environmental Engineering from Universitas Brawijaya.
 Dina works across sustainability, environmental compliance, and climate action, supporting public and private sector projects in energy, transport, urban, and industry. With 7+ years of experience across consulting, NGOs, and multilateral institutions, she brings expertise in impact assessment, GHG accounting, and sustainability planning. Dina holds a degree in Environmental Engineering from Bandung Institute of Technology.
 Almira is an environmental engineer with over six years of experience in waste management system design, circular economy strategy development, and community-based environmental projects. She holds a Master’s degree and a Professional Engineer certification, specializing in environmental management and technology. She also participated in a fellowship program at the Waste Management Department at Mecklenburg County, North Carolina.
 Tatwa works at the intersection of corporate climate strategy and environmental science research. With 6+ years across consulting, corporate sustainability, policy, and ongoing PhD research in hydrothermal carbonization at Ghent University, Tatwa leads his team to help companies translate net zero ambitions into credible, data-driven decarbonization roadmaps.
 Nailah has assisted holding companies and SMEs which have achieved SBTi validated net zero targets. With over 3 years experience at WRI Indonesia, she has been engaged with over 50 companies and possessed expertise ranging from GHG Accounting to science-based target setting. Nailah earned a Business degree from the Bandung Institute of Technology, including an exchange program at the University of Pennsylvania.
 Tomi Haryadi serves as Director of Bestari Sustainability, leading strategy and delivery of climate, nature & circular economy solutions for companies across sectors. With 20+ years of experience in environmental programs across Asia, including roles with international organizations, he brings strong expertise in program management, partnerships, and sustainable development. He holds degrees in Chemistry from the University of Indonesia and Environmental Planning and Management from IHE Delft, the Netherlands.
 Friska Sinuraya is an experienced Director of Operations with a demonstrated history of working in the non-profit organization management industry. Skilled in Management, Human Resources, Logistics Management, Finance, and Accounting. Strong operations professional with a Master of Science (MSc) focused in Strategic Management from Rotterdam School of Management, Erasmus University.
 Tieke leads Human Resources at WRI Indonesia, bringing 20+ years of experience across international development and private sector organizations. With expertise in HR strategy, compliance, and organizational development, she has held senior roles at Save the Children, Coffey International, and P&G, and holds a degree in Public Law.
 Anthony Utomo drives renewable energy initiatives at KADIN, advocating for policies that accelerate clean energy adoption and innovation. With leadership roles in the solar PV industry and as Managing Director of Utomodeck Group, he advances low-carbon solutions across manufacturing, mobility, and renewable project development while fostering international collaboration and sustainability.
 Ary brings 15+ years of experience in planning, monitoring, evaluation, and learning across community development, climate change, governance, and social inclusion. With strong expertise in project design and risk analysis, he has supported initiatives with organizations such as UNDP and The Asia Foundation, and holds a degree in Communication Studies from Universitas Gadjah Mada.
 Arief Wijaya is the Managing Director of WRI Indonesia with responsibilities to oversee programs in land use, climate, energy, cities, and oceans while advancing climate and forest initiatives. With expertise in forest landscape management, REDD+ MRV, and low-carbon development, he holds a PhD in Geoinformatics from TU Bergakademie Freiberg and an MSc from ITC Netherlands.